This is part four of a series of articles on “executing successful business surveys.” The first part presented applications of surveys in business focusing on satisfaction surveys, and introduced basic survey methods. The second part discussed the decision of whether to execute surveys in-house or seek the assistance of an external consultant, provided warnings against hastily employing surveys without due consideration of alternative tools, and introduced basic terminologies. The third part presented the various cases for determining sample size and detailed the first step of conducting a survey study. In this part we continue presenting the remaining steps of a survey study.
Steps of Survey Study
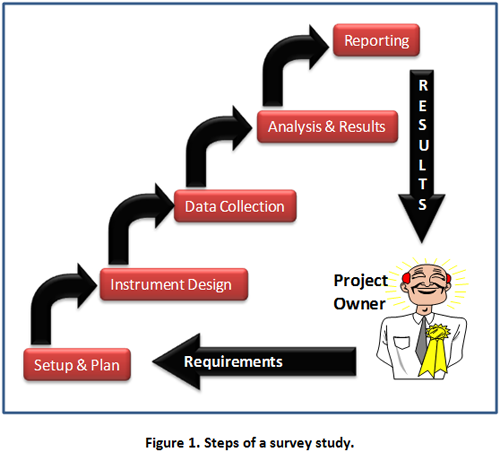
The diagram in Figure 1 shows the 5 steps of a typical survey study. The first step “Setup & Plan” has already been addressed in the 3rd part of this series1; so we shall continue next with the second step.
Step 2: Instrument Design
Many people reduce the survey process to instrument design; this gets them quickly into troubles, as the quality of instrument design depends to a large extent on the outcome of the previous step “Setup & Plan.” The instrument (i.e. questionnaire) typically consists of the following components:
- Header.
- Demographics/ General Information.
- Body.
- Footer.
The header typically consists of the survey title; information on the organization conducting the survey; the purpose, anonymity, and contact (if needed); and instructions for completion (a sample is sometimes provided.)
The footer typically consists of a thank you note to show appreciation for survey completion, a promise note of giving feedback to those who participate (this is highly recommended because it shows commitment and openness), and instructions on how to deliver completed instrument; e.g. deadline, location.
In some surveys, part or all footer items are included in the header; or, sometimes, the combined header and footer information are prepared as part of a separate cover letter accompanying the survey instrument.
The anonymity statement is a key element of the header/footer; especially if the project owner has some authority over participants. Examples include employee satisfaction/ attitude/ loyalty surveys, and supplier surveys.
Organizations use one or more of the following methods to achieve anonymity:
- Use a code on the questionnaire (e.g. numerical label) to identify participants. A designated independent person will know who is who.
- Abstain from asking for the name of the participant.
- Hire survey firms committed to employee privacy.
The demographic information is sometimes necessary to support stratification analyses2; demographic information includes name, position, department, location, gender, age category, and education level. If it is unnecessary, the name ought to be deleted or made optional. The demographic information is sometimes placed after the ‘body’ in order to avoid any negative feeling that might result from asking for information that some consider private.
The ‘body’ of the instrument is where the subject questions are asked. It is critical that, to the extent possible, least number of questions is asked. When developing questions, ask:
- Is the question relevant to the survey purpose?
- Is the question specific to not more than one aspect of the subject?
- Is the question direct to the point?
It is important to avoid asking questions that are:
- Leading… they bias the respondent.
- Compound… they lead to partial or no answer.
- Long… they discourage the respondent from answering.
- Vague… they lead to meaningless response.
- Acronym/Jargon… they confuse or lead to no answer by some respondents.
- Double negative questions… they may lead to answer opposite to what the respondent wants.
Figure 2 depicts the types of questions. Open questions allow the respondent to respond in his own words. Also, open questions may uncover additional issues or information that proves to be valuable; for example in a survey study of suppliers3, answers to the open questions by suppliers was later utilized by the company to adopt important strategic initiatives.
Though closed questions control the respondent’s answer; they have the advantages of:
- Supporting quantitative analysis.
- Overcoming some respondents’ inability to express.
- Overcoming illegibility problem, which characterise responses to open questions.
The classification of closed questions is based on the possible response scale. In ratio questions:
- Answers are real numbers.
- The difference between successive scales is the same.
- A zero is a ‘zero’; e.g. if Ali is 20 years old and Jasim is 40 years old; Jasim is twice as old as Ali.
- Examples are: “What is your age?” “How many employees are in your organization?”
In interval questions:
- Answers are real numbers.
- Difference between successive scales is the same.
- A zero is not a ‘Zero’; e.g. a 40 degrees Celsius is not twice as hot as a 20 degrees Celsius. But the difference between 20 and 21 is the same as the difference between 21 and 22.
- Example: “What is the temperature?”
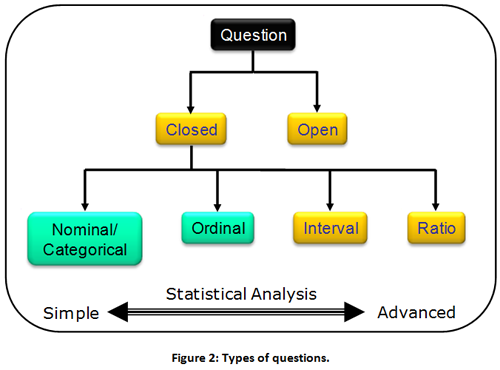
In ordinal questions:
- Difference between successive scales may not be the same for different respondents;
- Examples: “How do you rate this training program on a 5 point scale?” “How satisfied are you with the performance of the parliament on a 5 point scale?”
In nominal/categorical questions:
- Answers are not real numbers, rather they are arbitrary codes.
- Example: “In which department do you work?” answer options 1 = Commercial, 2 = Engineering, 3 = Finance.
In some nominal/categorical questions, the response could be multiple (i.e. respondent may select more than one response); for example:
Which quality techniques do you know? (More than one answer can be selected)
- TQM
- Benchmarking
- ISO 9001
- Quality Circles
- Six Sigma
- Others_______________
The following are some remarks on the type of questions:
- Nominal and ordinal are more often used than others in surveys.
- Most statistical techniques are designed for ratio and interval types; since they are more suitable for engineering and science applications!
- Ratio scale is often coded in surveys; i.e. converted to a nominal scale. For example; answers to a question about pay scale could be coded as:
- High (more than KD 100,000 per year),
- Medium (between KD 12,000 and KD 100,000 per year), or
- Low (less than KD 12,000 annually).
- Post-coding is preferred over pre-coding because it gives the analyst flexibility to change his/her mind if s/he needs to. For example; asking “what is your pay?” is better than asking “what is your pay category (as per 5 pre-set categories)?” With the former, the analyst may reduce or increase the number of categories during the analysis, as needed.
- The types of questions determine the possible statistical analysis. For example, for a question on nationality (Kuwaiti, Arab, and Foreign); analysis is limited to calculating: number/frequency, percentage, and mode of each category (i.e. category with highest frequency.) Whereas; a question on satisfaction (1 to 5, where 5 is high), additional analysis include calculating the minimum, maximum, average, range, and median values.
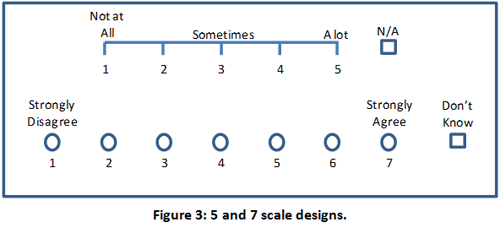
The response scale design is an important feature of the survey instrument. Alternative number scales are 3, 5, 7, 9, and 11. A higher number of options give the participant flexibility to express opinion; but up to a point beyond which the respondent’s ability to make distinctions between successive scales becomes difficult; that explains why the scales 5 and 7 are most common. A response scale of 2 restricts respondent from expressing non-extreme opinions; and leads to simplistic and difficult to interpret results. Even response scales are not commonly used because they do not provide balance (i.e. the same number of options) between the two extreme options; and they do not permit one to register a neutral opinion.
Some response scales include words on all options; while others limit their use to extreme and/or middle options (Figure 3.) In general, the latter design is preferred because the words on the internal options mean different things to different respondents; especially if a higher than 5 scales is used. Another issue is whether to allow “do not know” or a similar option. Allowing ‘Not Applicable’ or ‘Do not Know’ encourages the respondent to be truthful; and ensures that respondents won’t get angry and abandon the survey when they feel that they are unable to express their exact opinion. It is important, though, to distinguish the design of such options; e.g. square rather than circle (Figure 3.)
Step 3: Data Collection
Key issues and activities in the data collection step are:
- Pre-Testing
- Dealing with missing values
- Timely data entry & verification
- Sample size revision, if needed
Pretesting is an important activity which entails trying out the survey on a small group of representative individuals. The objective is to ensure that instructions are well understood, questions are ‘good’, rating scale is understood, time to complete the survey is acceptable, and participants have interest in completing the survey.
Missing values (due to some participants not completing part or all of the survey questions) poses a challenge and sometimes a problem if too many values are missing. In such a case, the survey may have to be re-designed. However, there are two methods to deal with missing values:
- Ignoring missing values, and count only valid answers to a question. This will mean that the sample size differs between questions.
- Imputation: means estimating a value for each respondent who does not answer a question, based on the answers that others give; e.g. use average.
It is highly recommended that data is entered as it is collected on the same day. The reasons for that are:
- Discover any completion problem (e.g. missing values, wrong values).
- Easier to contact respondent immediately than to wait.
- Finish on time.
Step 4: Analysis & Results
Many numerical and graphical statistical analyses are possible; some are descriptive and some are inferential; some are simple and some are advanced. In general, surveys require statistical analysis of introductory level. The following are some examples:
- Measures of centrality; e.g. mean, median, mode.
- Measures of variability; e.g. variance, standard deviation, range.
- Pie charts, bar graphs and tables, spider diagrams.
- Hypothesis testing; e.g. comparing the means of values belonging to different classification/stratification to establish if the difference is statistically significant.
Description of the various statistical methods and graphs is beyond the scope of this article.
Step 5: Reporting
Most reports of business surveys are prepared and submitted on a PowerPointÒ presentation format. The organization of the presentation usually follows the survey process steps with focus and detail allotted to results and interpretations. The following is a typical organization:
- Background on survey purpose, subject, and population Segments.
- Survey conduct & analysis (sometimes not included).
- Results and interpretations.
- Actionable recommendations.
Conclusion
Conducting a successful business survey could be a challenge or joy; failing to go about it the right way causes frustration and often yields invalid results. Hopefully with the four-part series we have provided, the process can be made simple and joyful. Good Luck!
Sources
- Aldowaisan, T. “Executing Successful Business Surveys – Part 3.” Collaborate, June, pp. 3-4 & p. 8; and GLC website (http://www.glc-im.com/publication/publication.html), 2010.
- Aldowaisan, T. “Executing Successful Business Surveys – Part 2.” Collaborate, May, pp. 2-4 and GLC website (http://www.glc-im.com/publication/publication.html), 2010.
- “Measurement of opinion of beneficiaries on the Mechanism for Supporting National Industry in the Local Oil Sector.” Final Report, Kuwait National Petroleum Company, study conducted by Gulf Lead Consultants, 2006.
Tariq A. Aldowaisan has a Ph.D. from Arizona State University in 1990. He is currently an associate professor of industrial and management systems engineering at Kuwait University, and a general manager of Gulf Lead Consultants. He has professional certifications from reputable organizations; they are Certified Safety Professional (CSP) from the Board of Certified Safety Professionals (BCSP), USA; and Certified Quality Engineer (CQE), Certified Quality Auditor (CQA), and Certified Quality Manager/ Organizational Excellence (CQM/OE) from the American Society for Quality (ASQ). He has over 20 years consulting and training experience in quality, organizational excellence, management systems design, and occupational safety.
CREDITS: Dr. Tariq A. Aldowaisan