This is part three of a series of articles on “executing successful business surveys.” The first part presented applications of surveys in business focusing on satisfaction surveys, and introduced basic survey methods. The second part discussed the decision of whether to execute surveys in-house or seek the assistance of an external consultant, provided warnings against hastily employing surveys without due consideration of alternative tools, and introduced basic terminologies.
We start off this part with a presentation on how to determine the sample size for various cases; then we highlight the typical steps of conducting a survey study.
Determining the Sample Size
Selecting the appropriate sample size n is an important activity in survey studies, because it is related to the quality of inference (i.e. conclusions regarding the population) and sometimes cost; as a larger than necessary sample size could mean a waste of money.
Four considerations determine the sample size:
1. Confidence level (CL); i.e. how much certainty in the result is acceptable. A larger confidence level leads to a larger sample size. Commonly, 95% confidence level is used, which translates to a Z value of 1.96 to be substituted in the sample size equation. Other choices of confidence levels and corresponding Z values are:
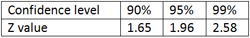
2. Error (E); i.e. how much error in the result is acceptable. A smaller error leads to a larger sample size. Typical choices of E are 3% and 5%.
3. Prior knowledge of opinion tendency (p); i.e. for key items on the survey, what is the estimated result p. The closer the p value is to 50%, the larger the sample size.
4. Population size (N). A larger population size leads to a larger sample size.
For a 1 to 7 scale, a result of 5.5 on a given item for CL=95% and E=3% is interpreted as:
It is expected that 95% of population to give a rating in the range of (0.03*5.5) ± 5.5 (i.e. between 5.335 and 5.665) on that item.
Case 1: Population is infinite, unknown, or too large (> 20,000)
The sample size formula is:
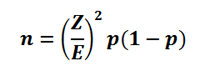
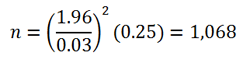
Example 1: For a confidence level of 95% (i.e. Z = 1.96), E of 3%, and p of 50%, the sample size is calculated as follows:
Case 2: Population is finite (< 20,000)
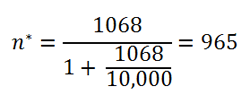
The adjusted sample size n* formula is:
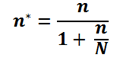
Example 2: Using N = 10,000 in Example 1, the adjusted sample size is:
The reader may use sample size calculators available on the website; e.g.
http://www.raosoft.com/samplesize.html
Case 3: Population is stratified – Proportional Approach
In part two of this series of articles we introduced the concept of stratification and we explained that it should be used when the analyst suspects that results are impacted by certain demarcations (i.e. stratifications) of the population; e.g. gender, age, education, position, etc.
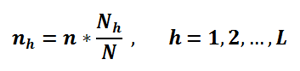
In the simple random sampling Cases 1 and 2, sample sizes are determined without consideration to stratification. However, if the population N is divided into L strata, each of size Nh such that N1 + N2 + … + NL = N, and a sample size n (determined as in Cases 1 and 2) is to be divided among the L strata, each of size nh such that n1 + n2 + … + nL = n, the proportional allocation of n is given by the formula:
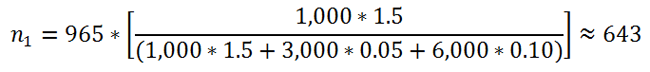
Example 3: if in Example 2 the determined sample size 965 is to be proportionally allocated among a 3-stratum population of sizes 1000, 3000, and 6000; then
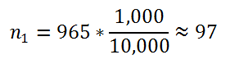
n2 and n3 are calculated similarly to be 289 and 579, respectively.
Case 4: Population is stratified – Optimal Approach (Given Fixed Sample Size)
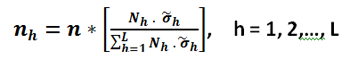
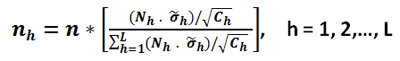
The optimal allocation of sample size n in stratum h to get the most precision from a stratified sample is a function of Nh size and the variance values in the stratum associated with key variables (i.e. question items) to be observed in the survey. As expected, the nh size is large when Nh and are large. The problem is that is usually unknown; therefore, an estimate variance of a surrogate variable that is adequately correlated |r| > 0.7 with the key variable to be measured can be used, or the variance of the same key variable to be measured but from a previous study (say last year) can be used. The optimal allocation of the sample size using Neyman allocation formula is:
Example 4: if in Example 2, the determined sample size 965 is to be optimally allocated among a 3-stratum population of sizes 1000, 3000, and 6000. Given that last year study yielded for a key variable to be measured standard deviation values of Applying Neyman formula, we get
n2 and n3 are calculated similarly to be 65 and 257, respectively.
Case 5: Population is stratified – Optimal Approach (Given Fixed Budget)
The optimal allocation plan of sample size n would give highest precision to least cost stratum Ch. The following formula achieves that:
The nh size is large when Nh and are large, and Ch is small.
Example 5: for our example, assuming that strata 1 and 2 pertain to population individuals who have internet access, so they may provide their input on-line; whereas, for stratum 3 which pertains to field operators, the data will be collected manually. This leads for example to a cost per participant of 5 KD for strata 1 and 2 and 15 KD for stratum 3. Using the above equation, we may calculate for optimal sample allocation for stratum 1 as follows:
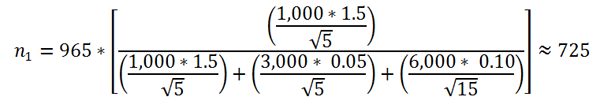
n2 and n3 are calculated similarly to be 73 and 167, respectively.
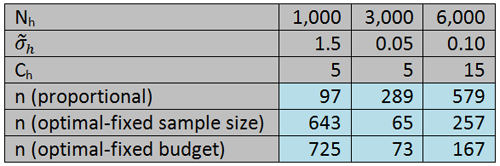
The following table compares the results of proportional and optimal allocation.
It is important to note that in order to obtain the required sample size a larger sample should be taken. Often times, some selected participants do not respond and some provide erroneous responses.
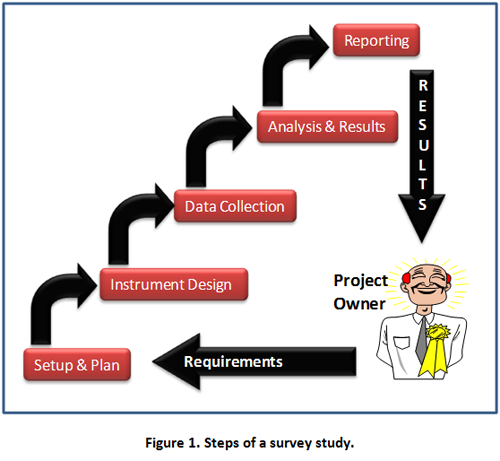
Steps of Survey Study
The diagram in Figure 1 shows the 5 steps of a typical survey study; where the project owner interfaces with the first and last steps through defining requirements and receiving results, respectively. In the following paragraphs we highlight key points in each step.
Step 1: Setup & Plan
Key questions to be addressed during this step are:
- What is the survey purpose?
- What decisions will the survey support?
- What is the survey scope? What is the population (Organizations, Departments, Groups, or Individuals)?
Novice survey designers mistakenly start off with writing questionnaire items. Whereas, experienced ones wisely spend elaborate time defining the survey purpose and scope.
Another set of questions pertaining to those likely to use the survey for decision making is:
- Who will use the results?
- How will s/he (or they) use the results?
- What is the user educational/professional level?
- What is the user preferred reporting format and language?
Other set of questions to understand the subject of the survey is:
- What are the various specific aspects of the subject?
- Are these aspects defined in literature?
- Has the subject been studied before? When? How?
- Has a similar survey been done before? By who? Do we have the results? Do we want to benchmark?
- How soon are the results needed?
A key recommendation here is for the analyst not to re-invent the wheel. A word of warning on repeated surveys (i.e. surveys with the same questions that are repeated at fixed or occasional basis1) is to act on previous survey results and publicize such actions; otherwise, participants lose interest in the next time the survey is conducted. Moreover, the duration between repeated surveys should be long enough to allow for change to take place between consequent surveys; a commonly recommended interval is 1 to 2 years for surveys that address ‘soft’ issues company-wide; e.g. leadership, motivation, communication, etc.
Another set of questions pertaining to members of the population is:
- Who has the information we require (population)?
- Is the population homogeneous relevant to the survey questions?
- If participants are organizations, who in the organization should we target?
- What is the background of participants? What language they are comfortable with?
- Do we have their current addresses (mail, e-mail, phone numbers, etc.)?
In a survey study conducted by KNPC to solicit the opinion of suppliers on certain recommendations, the population consists of companies2. The question became: Who in each company should participate? Is it a single person or more than one person from each company? If more than one, should they provide a single response or each provide his/her own response? Many tricky questions the analyst should properly address to ensure validity of results.
Another set of questions for identifying the suitable survey method is:
- What is the appropriate survey method for the survey purpose?
- How complex are the questions? Would the participants be able to respond without support?
- How many completed surveys do we need?
- If interviews, who will collect the data? Are they trained?
In the same KNPC study, since the survey subject pertains to opinion on a strategic level (not operational), top managers are targeted. To ensure that the managers themselves (not their secretaries or assistants) respond to the questions, the participants are personally invited to a workshop in which they were asked to complete the survey. Other reasons for choosing the workshop method are:
- The complexity of the survey questions requires introductory presentation by the consultant.
- The objective of the study is not limited to the survey; it also includes holding brainstorming sessions to solicit additional views. That was conducted after the participants completed the survey.
Another set of questions for data entry of completed surveys is:
- What hardware/software is required?
- Are data entry templates ready?
- Who will enter the data? How much time will it take?
- Are they trained?
- Who will verify? How?
Improper performance of this step leads to the following common mistakes:
- Collecting information that is never acted upon.
- Collected information that is misaligned with purpose.
- Trying to do too much.
We will continue our coverage of the remaining steps in the next article.
Sources
- Glenn Firebaugh, “Analyzing Repeated Surveys,” Sage Publications, Inc. 1997.
- “Measurement of opinion of beneficiaries on the Mechanism for Supporting National Industry in the Local Oil Sector.” Final Report, Kuwait National Petroleum Company, study conducted by Gulf Lead Consultants, 2006.
Tariq A. Aldowaisan has a Ph.D. from Arizona State University in 1990. He is currently an associate professor of industrial and management systems engineering at Kuwait University, and a general manager of Gulf Lead Consultants. He has professional certifications from reputable organizations; they are Certified Safety Professional (CSP) from the Board of Certified Safety Professionals (BCSP), USA; and Certified Quality Engineer (CQE), Certified Quality Auditor (CQA), and Certified Quality Manager/ Organizational Excellence (CQM/OE) from the American Society for Quality (ASQ). He has over 20 years consulting and training experience in quality, organizational excellence, management systems design, and occupational safety.
CREDITS: Dr. Tariq A. Aldowaisan