This is part one of a three part article on “executing successful business surveys.” This first part discusses applications of surveys in business, and introduces key concepts and definitions; the second part details typical steps to executing surveys. The third part focuses on presenting the technical methods commonly used in surveys; especially in sampling, data representation, and statistical analyses. Microsoft Excel® shall be used for that purpose.
Applications of Surveys in Business
There are numerous business applications/purposes of surveys; common ones are:
- Soliciting the views or opinions on a planned or existing product, service, or system/ organization; e.g. how satisfied are citizens and expatriates with the public services in Kuwait? How satisfied are XYZ company employees with the IT services and supports provided by the Information Systems Department? What are the views of local vendors, contractors, and consultants with the recommendations of a Local Industry Support Mechanism issued by Kuwait Petroleum Corporation1? What is the customers’ perceived quality of services offered by public government organizations in Kuwait; what is the difference between expectation and actual experience/perception associated with the various services’ attributes (e.g., SERVQUAL survey instrument2)? What are the views of private sector employers on the law passed by Kuwaiti Parliament on increasing the local workforce contribution in the private industrial sector3? What are the views of executives on the economic benefits of quality4?
- Ascertaining the relative importance of initiatives, features or characteristics of a product or place. Which of the planned internal and external initiatives/projects should the company pursue in the next five years? What is the relative importance of these initiatives/projects?
- Comparing two or more competing products, services, or programs; e.g. On a scale of 1 to 5, how does Kuwait University’s Industrial Engineering program compare with King Fahd University’s program considering the criteria of: curriculum, instructional supports, faculty members, technical support staff, administrative support staff, library, and research support.
Business survey results are commonly used for identifying improvement initiatives. The survey analyst may himself, or relevant personnel, deduce such initiatives from the
survey results or directly asks respondents, as part of the survey, to provide their suggestions and recommendations. Either way, a valuable usage of business survey results is to guide discussion groups in the organization.
“A valuable usage of business survey results is to guide discussion groups in the organization”
Satisfaction Surveys
Satisfaction measurement is of special interest to the business community; measuring satisfaction of various stakeholders is a key quality/business excellence practice; e.g. in ISO 9001, Baldrige, and EFQM. There are three types of satisfaction surveys:
• One-dimensional (1-D) satisfaction surveys, where respondents are only asked to cast their opinion; e.g., on a 7-point Likert Scale, regarding specific attributes of an entity. For example:
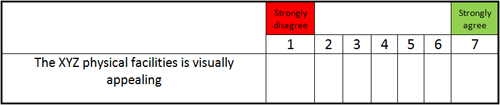
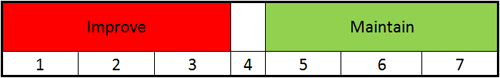
Figure 1 provides a simple model for management action based on the results of a 1-D satisfaction survey. If for example, the results on the question item above show that on average customers’ opinion is low (e.g. 1.5 score), then management needs to take an improvement action. The urgency of an action increases when the item score approaches one. Note that the survey results do not recommend specific action(s) to remedy the situation. Surveys are not usually good for such a purpose; a better approach is to perform a more elaborate benchmarking study, or conduct a focus group workshop to brainstorm for specific actions.
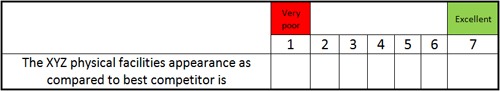
• Two-dimensional (2-D) satisfaction surveys, where respondents are additionally asked to rate the importance of each attribute; e.g. on a 7-point Likert Scale. For example:
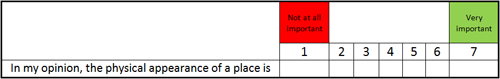
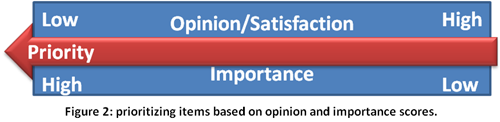
The results on both the opinion and importance can be used independently to provide indication of priority (Figure 2); i.e. an item scored by respondents with lowest opinion/satisfaction is awarded highest priority; similarly, an item scored highest on importance is awarded highest priority.
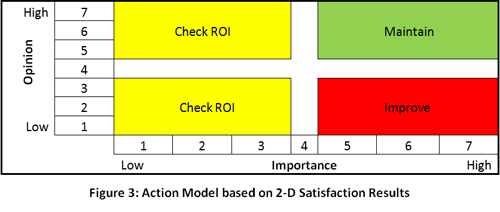
Alternatively, the opinion and importance results can be used jointly to provide indication for action. The quadrant diagram (Figure 3) provides a model for management action based on the results of a 2-D satisfaction survey. The interpretations of the green and red quadrants are similar to the 1-D model. The urgency for improvement action increases as the item score nears one on opinion and seven on importance. For the yellow quadrants, management needs to question its level of investment. A word of caution, however, is to make sure that before reducing or shifting investment from an item (e.g. physical appearance), to check if such item is hygiene. An item is hygiene if its absence lead to dissatisfaction, whereas, its presence does not lead to satisfaction.
Gap analysis and multiplicative approaches calculate derived scores from the opinion and importance scores5. In the gap analysis, priorities are awarded to items based on a gap score that is calculated as the difference between the importance and opinion scores for that item. For example, an item with a performance score of 7.8 and an importance score of 9.5 would result in a gap (priority) score of 1.7. That item would naturally have a higher priority if the performance score is low and/or importance score is high. The gap result should be presented with importance scores to properly break gap score ties, if any.
In the multiplicative approach, areas for improvement are prioritized based on a weighted dissatisfaction score computed for each item. The score is determined by first calculating the difference between the highest possible satisfaction rating (say 11 for totally delighted) from the average customers’ perception of the company’s performance (say 3.2) then multiplying the result (i.e. 7.8) by the importance weight (e.g. 86% if the item importance is 9.5 out of 11). This yields a weighted dissatisfaction score of 6.7. Note that if performance is scored high on the item, the difference would be small and thus the weighted dissatisfaction score would accordingly be small; signaling that the item is low priority.
• Three-dimensional surveys, where respondents are additionally asked to rate; e.g. on a 7-point Likert Scale, the performance of the organization on each attribute in comparison with the same characteristic on a competing entity. For example:
The following cube (Figure 4) provides a model for management action based on the results of a 3-D satisfaction survey.
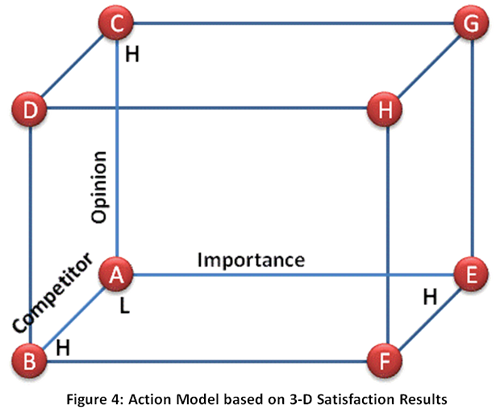
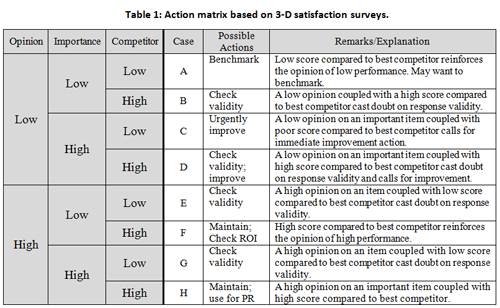
A matrix may be developed to guide possible actions based on the 3-D cube model as shown in Table 1.
For some survey subjects, there are already pre-designed set of questionnaire; e.g. SERVQUAL. Also, for some studies, the same survey is administered periodically (say every 3 years) to trace score changes over time (i.e. horizontal analysis); e.g. employee loyalty surveys. It is important that survey analyst thoroughly researches the existence of the same or similar surveys to the subject of interest before designing one; a lot of effort and time can be saved, and more importantly, higher gains can be achieved from using an already existing survey instrument (i.e. questionnaire).
The best practice improvement resource (BPIR) provides a large sample of individual and business surveys covering various topics related to leadership; social and environmental responsibility; strategy and financial management; customer and market focus; measurement, benchmarking, and knowledge management; process management; HR focus; and business excellence and developing business capability6.
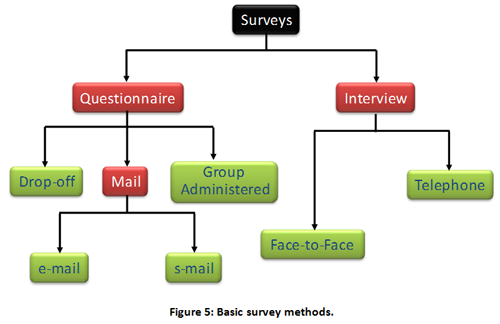
Basic Surveys Methods
Figure 5 shows the various survey methods. These methods may be compared on a number of criteria. Group administered (or workshop) is most useful and assures most accurate responses; however, it is most expensive. E-mail or web-based surveys are most efficient; however, response rate is often low. Moreover, it does not provide the same quality of responses as the group administered method. Face-to-face is very costly; it is more time consuming than the group administered approach. However, it has the advantage of allowing the interviewer to get closer to the respondent; allowing him to get more detail and insight. Telephone is less costly than Face-to-face but it tends to be more intrusive; and often leads to an unpleasant outcome if the subject is busy.
A major challenge is to have a high response rate. Some of the ideas to achieve this objective are:
- Short Surveys… single page if possible.
- Postage-Paid.
- Pre-addressed.
- Follow-up with reminders; e.g. phone call reminders, postcard reminders.
- Provide incentives; e.g. gifts, money.
Personalized request… address specific individual.
Sources
- “Measurement of opinion of beneficiaries on the Mechanism for Supporting National Industry in the Local Oil Sector.” Final Report, Kuwait National Petroleum Company, study conducted by Gulf Lead Consultants, 2006.
- Parasuraman, A., Zeithaml, V.A. and Berry, L.L. (1988), "SERVQUAL: a multi-item scale for measuring consumer perceptions of the service quality", Journal of Retailing, Vol. 64, No. 1, pp. 12-40.
- Aldowaisan, T. (Study Supervisor), Eng. F. Al-Mutairi, Eng. Hanaa Al-Tayar, Eng. Adel Al-Suger, Eng. Rehab Al-Humaidan, Eng. Asmaa Al-Shatti. “Increasing the Local Workforce Contribution in the Private Industrial Sector,” Industrial Planning Department, Public Authority for Industry. 93 Pages, 1st Ed. 2000, 2nd Ed. 2004.
- “Economic Case and Image Survey.” Final Report, American Society for Quality, study conducted by Market Probe, Feb. 9, 2004.
- Fontenot, G., Henke, L., and Carson, K., “Take action on customer satisfaction.” Quality Progress, 40-47, July 2005.
- www.bpir.com.
Tariq A. Aldowaisan has a Ph.D. from Arizona State University in 1990. He is currently an associate professor of industrial and management systems engineering at Kuwait University, and a general manager of Gulf Lead Consultants. He has professional certifications from reputable organizations; they are Certified Safety Professional (CSP) from the Board of Certified Safety Professionals (BCSP), USA; and Certified Quality Engineer (CQE), Certified Quality Auditor (CQA), and Certified Quality Manager/ Organizational Excellence (CQM/OE) from the American Society for Quality (ASQ). He has over 20 years consulting and training experience in quality, organizational excellence, management systems design, and occupational safety.
CREDITS: Dr. Tariq A. Aldowaisan