Grasilene Division is engaged In the manufacturing of Viscose Staple Fibre to cater to the needs of about 280 Textile Mills.
With increasing competitive pressures on the business, Customer Satisfaction became the key factor to sustain in the market.
Ever since, identification of customer needs and addressing them is on the top of the agenda of our Unit.
To augment it, the Unit adopted a systematic and comprehensive method, a strategic tool called ‘Quality Function Deployment’.
The project involved compiling the needs of different customers and summing up the customer voice in a quality matrix and translating it in to product and process parameters. The relationships, comparisons and engineering competitive assessment were also incorporated.
As a result of analysis of QFD matrix, priority issues emerged. Based on this, competitive targets were established and time bound actions initiated to accomplish these targets.
On the completion of the project, the organization achieved:
- 10 % increase in the conformance of the critical product parameters
- 50 % reduction in CV%
Customer complaints have come down from 3.6 Nos. / 10,000 MT to 1.53 Nos./10,000 MT.
Vision
“To be the best customer oriented Viscose Staple Fibre manufacturer”
Mission
“To achieve reduction In customer complaints below 2 Nos. / 10,000 MT by systematically identifying customer needs and addressing them.”
Need for Quality Function Deployment
Viscose Staple fibre (VSF) is used as raw material by various yarn manufacturers. The VSF is blended with fibres of polyester, cotton, acrylic, wool and silk etc. Cent percent VSF yarn is also manufactured. The various segments have their own yarn and process specifications. It is therefore necessary to bring the different customer voices on to a common platform and translate these in to our product specifications and process parameters.
It is then possible to comprehensively analyze the relationships and depending upon the severity, prioritization of the
Deployment
Inputs were taken from different functional groups like:
- Marketing experts strategically placed in major customer locations
- Customer visits by cross-functional teams comprising process, marketing and inspection professionals at regular intervals.
- Customer conference
- Interaction with customers from time to time and customer feedbacks
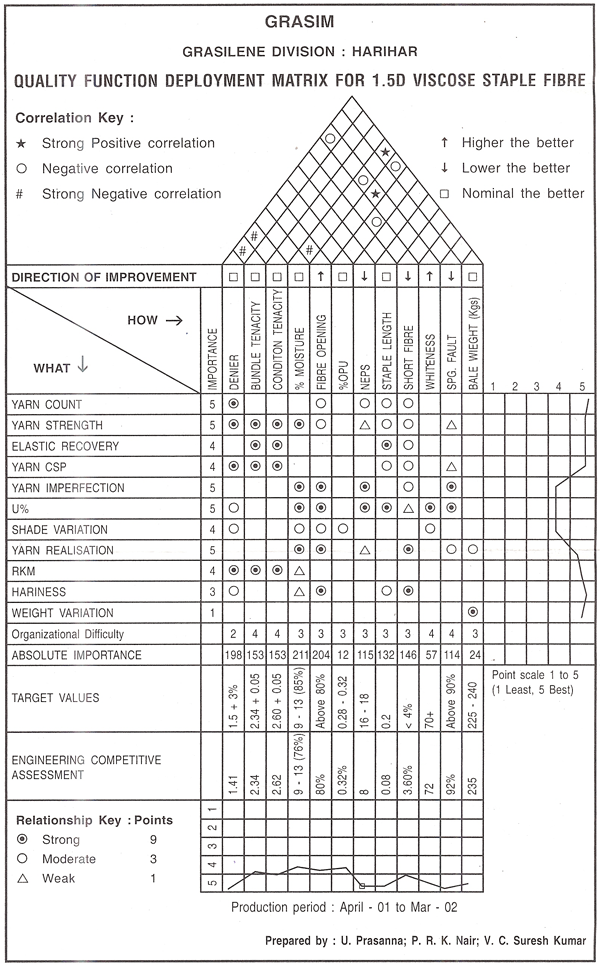
HOUSE OF QUALITY
Stage 1
Having these inputs, customer voice Customer requirement with respect to yarn was put in the left side box of the quality matrix. Important characteristics of the yarn were included here. The relationship of these characteristics with the technical specification of VSF was drawn in the central portion of the matrix. The top vertical columns are the product specifications that have a direct bearing on the voice of customer.
By assigning the grades to the relationships, as per their severity a strong, medium or weak, Affinity matrix was prepared. For comprehensively understanding the relationships, the corelations between the product specifications were also drawn on the roof of the house. These were also graded as strong positive, positive, negative and strong negative. This understanding was critical as altering some parameters may have adverse effect on the other parameters. In such cases optimization techniques were employed.
Direction of improvement (i.e. lower the better, higher the better or optimum the better) plays important role in planning actions for improvement. This was depicted just below the roof.
Absolute importance for each of the product specification is the key information to draw the action plans. This was calculated as under:
Voice of customer was graded on a scale of 1 to 5 (a)
Fibre specification affinities graded as strong, medium & weak. These were conventionally scored 9, 3 & 1 respectively. (b)
Sum of multiplications of (a) & (b) is the absolute importance.
This was supplemented by Unit’s Engineering competitive assessment, organizational difficulty and the target value and all the information was depicted in the bottom portion. at the right hand side of the matrix.
While doing the whole exercise, comparison with other competitive organizations must be done to know where do we stand. This particular exercise was also carried out and a comparative graph was drawn on the right side of the roof.
Stage 2
Taking relationships of product quality specifications with process specifications another similar matrix was developed.
Stage 3
In the third stage of QFD, relationship between the process specifications and operating parameters / Equipment conditions were plotted.
Remedial Journey
Vital few were identified which are as follows:
Improvement actions were initiated by taking up various projects.
The results are tabulated as under:
| Particulars | Unit | Before QFD | After QFD |
| Moisture | % Conformance (9-13%) | 80 | 90 |
| OPU | %CV | 14 | 7 |
| Cusotmer | Nos./1000 Complaints | 3.6 Tons | 1.53 |
Holding the Gains
To hold the gains attained and to monitor the processes, daily reporting system was developed. This was also displayed on the shop floor to create awareness. To improve the product quality and the variances these are reviewed by the management on daily basis and are also discussed in monthly review meetings.
CREDITS: K. Nagraj, WCM Cell, Grasim Industries Ltd., Kumarapatanam